
Thank you to everyone who took part in the Work and Wellbeing survey in June. A total of 1107 people responded, compared to 1415 in February 2021 and 1406 in October 2020.
Since carrying out the survey, we have been working hard to address the key issues that you said were important and progress is included in this update.
Wellbeing
As with previous surveys we have used the four standard questions from the Office for National Statistics to assess people’s feelings of wellbeing.
| ONS Question | University (mean scores) Jun 20 | University (mean scores) Oct 20 | University (mean scores) Feb 21 | University (mean scores) Jun 21 | UK (mean scores) Jun 20 | UK (mean scores) Oct 20 | UK (mean scores) Feb 21 | UK (mean scores) Jun 21 |
|---|---|---|---|---|---|---|---|---|
| How satisfied are you with your life? | 6.6 | 6.5 | 6.2 | 6.8 | 7.1 | 6.8 | 6.4 | 7.0 |
| The things you do in your life are worthwhile? | 7.2 | 6.8 | 6.7 | 7.1 | 7.5 | 7.4 | 7.0 | 7.3 |
| How happy do you feel? | 6.6 | 6.4 | 6.3 | 7.0 | 7.1 | 7.0 | 6.5 | 7.6 |
| How anxious did you feel yesterday? | 4.6 | 5.1 | 4.7 | 4.2 | 3.9 | 4.0 | 4.1 | 3.6 |
We see an improvement in scores since the last survey, consistent with similar improvements in the national figures. Reviewing the University figures further shows women are generally more positive than men and the MSA job family is the most positive. This might indicate that the MSA roles have been more easily adapted to remote working. Another clear factor is that the MSA respondents are more likely to be female (77% compared to 64% of all respondents) and have caring responsibilities. Remote working, as we have seen from previous surveys, has provided flexibility around such responsibilities.
We also asked how proud people are to work for the University, with the intention of using this as a main people KPI. On a scale of 1-10, 79% staff scored this at ‘6’ or above, 1%pt higher than the February 21 survey. We see the same pattern by gender and job family for the wellbeing measures.
Next steps
We will continue to use this data to provide longitudinal insight into the impact of the action taken on levels of engagement and wellbeing.
My Manager
We have relied heavily on the relationship between managers and staff to adapt to these new working patterns and to support staff who will have had to make difficult adjustments to both their home and working life. Overall staff’s attitudes to the way their managers have supported them remain positive. (Appendix 1).
Communications
The investments we have made in communications continue to show a positive response, though with some small reduction in satisfaction in recent months across the questions (Appendix 1). Reviewing the qualitative comments, the Town Halls remain highly valued, as do the VC weekly briefs.
Progress/next steps
Operational Updates have been reinstated, providing short, bite-sized updates on key issues ahead of the new academic year.
As soon as an operational decision was made, communications were created around Future Ways of Working, including webpages, e-mails and a Q&A.
New videos are being produced for staff and students on key issues, including safety measures on campus.
Future ways of working
We have a clear picture of people’s current working patterns based on response to the pandemic. We have also received positive feedback on the approach to determining future working patterns - favouring engagement, consultation and choice; with a recognition that individual needs have to be balanced with business need.
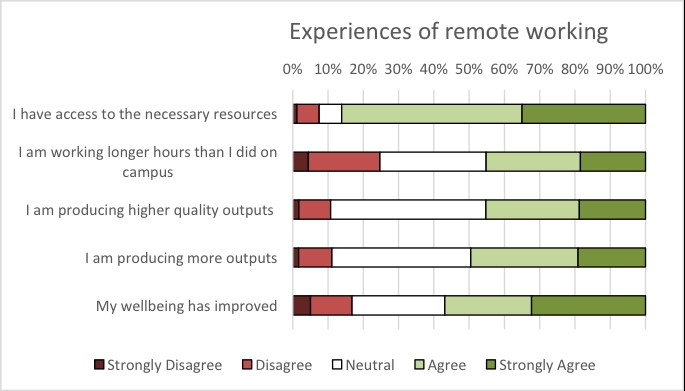
Further examination of the experiences of remote (home) working shows that, in general people are now well-equipped for these new styles of working and there is some evidence of improvement to wellbeing. Work output is judged by people to be largely neutral, with around 45% seeing net improvements. For the MSA job family this is a largely consistent pattern; for the E&R job family we see indications that some of these roles are perhaps less suitable for such an approach.
Finally we looked at people’s working preferences for the proportion of time spent of campus. Using the categorisation of High (4-5 days on campus), Medium (3 days), Low (2 days or less) shows the following by job family.

This shows a mix of preferences according to job family with the MSA job family favouring low campus presence and T&E and OFS favouring high presence. Preferences were more equally spread across the categories for the E&R job family.
The picture is perhaps unsurprising given the different types of work carried out in these job families. We also note from a range of qualitative comments that many staff are excluded from ‘hybrid working’ due to their roles and an important part of planning for the future will be to make sure that all staff feel included.
Progress/next steps
Work is already underway to determine future ways of working in the 2021-2022 academic year for professional services staff with office-based roles. Drawing on the insight from this survey, further guidance and support for managers has been provided regarding the effective management of a hybrid workforce, learning from the early adopter Departments. Resources covering campus, remote and hybrid working have also been developed for staff. This will continue to be built on as our learning grows about new ways of working.
While we will continue to assess the impact of hybrid ways of working through this survey in the next one we will focus on those staff whose roles are not suitable for hybrid working.
Caring Responsibilities
We wanted to hear from people with caring responsibilities in this survey. It has been topic which has come to the fore during the pandemic lockdowns and is continuing to be a significant concern for some people as we emerge into new working patterns. Of the survey respondents, 354 (32%) described themselves as having caring responsibilities for school-age children; a further 146 (13%) as having other caring responsibilities. A significant majority (84%) said that their line manager was aware of these responsibilities.
In general we saw that staff with caring responsibilities had higher life satisfaction scores, but those with ‘other’ caring responsibilities (often older relatives) had higher levels of anxiety. The challenge of combining caring and work responsibilities was described as ‘Difficult’ or ‘Very Difficult’ by 29% of respondents with a larger proportion (40%) being neutral. There are no helpful benchmarks, but this does appear to indicate that the University provides a reasonable level of support for those with such responsibilities. The main support was categorised as below (current, and what additional may help).
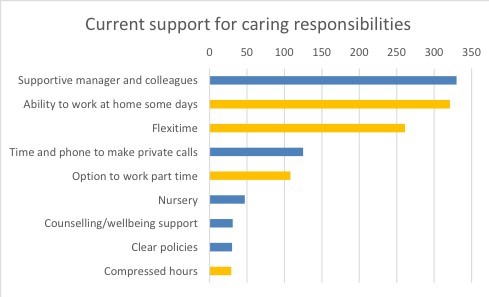
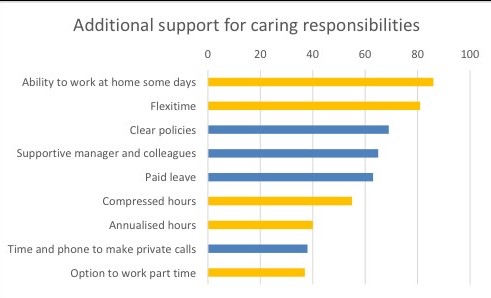
The bars highlighted in gold could be put under the category of flexible/alternative working arrangements. It is clear that this collection is highly valued, and to support our ED&I efforts to make more roles inclusive, we might consider how we promote such options for jobs at all levels.
Unsurprisingly, the option for carers leave was popular. The University has a policy on parental leave, which is unpaid. The policy on compassionate leave only applies to the death of an immediate family member, not to wider compassionate family issues, for example sickness of a child.
Progress/ next steps
As well as promoting flexible working options for a wider range of roles, we will work closely with the ED&I and Athena SWAN teams to look at options for carers leave and how we compare with other institutions.
A final word on future ways of working
Over 400 of you provided comments on future ways of working. The majority of these described the benefits of flexible working in particular for wellbeing and effectiveness. The challenges of working differently were also recognised especially in terms of hot desking, sharing space and working effectively in a hybrid world. This highlights both the opportunities and complexities that lie ahead in shaping new ways of working.
As we consider and understand the survey data in greater detail we will keep you informed on the solutions being developed and opportunities created to respond to what the survey is telling us.
A copy of the appendix to the UEB report can be found here.
If you would like the graphs presented on this page in a more accessible format please contact comms@bath.ac.uk.