We remain focussed on delivering against our Strategy 2021-26 providing a high-quality educational experience, excellent research and supporting the health and wellbeing of students, staff and other members of our community.
There has been a reduction in surplus to £6.2m from £17.7m in the previous year (on the internal HCOS basis, with a greater growth in expenditure (Staff costs rise of £12m, other expenditure costs rise of £28.1m) than the underlying increase in income of £30.1m.
This year saw the completion of and opening of two major capital projects, a new School of Management on the Claverton Down campus and the IAAPS research facility on the Bristol and Bath Science Park. There have been delays in commissioning the IAAPS facility, which opened commercially in January 2023. This combined with a higher proportion of grant-funded income has led to a loss for the year of £3.6m (2021-22 loss of £1.5m). IAAPS is in the start-up phase and will grow to operating capacity over the coming few years.
We have suspended our Historic Cost Operating Surplus (HCOS) target of 3% to enable greater investment in our strategy, most notably, in our plans to grow our research activity. Early indications are that this is proving successful with our research income increasing by 11.1% on the prior year to £45.0m and awards won in the year exceeded £60.0m. We need several years of growth at this rate to realise our ambitions.
The economic and industrial relations environments remain challenging. We are exposed to increases in inflation most notably on utilities but the impact has also been felt across the range of product categories that we buy. Similarly, higher inflation has added to the pressure for higher pay awards. The majority of our debt is fixed so our interest cost is not greatly affected by the increase in interest rates and we have been able to benefit from the higher rates available on cash deposits. In August 2022 we refinanced our European Investment Bank debt with a new £50m facility from the Pension Insurance Corporation. We also took this opportunity to close out our interest rate swaps (note 20).
We continue to retain significant cash and investment balances in preparation for supporting future investments to support our Strategy and for the refurbishment of the original 1960s and 1970s buildings on campus. Operating cash inflows were £47.2m, (2021-22 £49.3m) we spent £21.9m (2021-22 £27.4m) on capital investments.
The result of these cash flows reduced our Net Debt by £31.5m to £14.3m, our cash and investment balances leave considerable scope for investment to support our new strategy.
Council and the Executive Board monitors financial performance by reference to our internal measure of surplus, HCOS. This provides a more meaningful measure of our operating performance and excludes the material valuation adjustments which are shown on the SOCI. Further explanation and a detailed reconciliation of the deficit shown in the SOCI to HCOS is included.
HCOS is one of seven Key Performance Indicators that we use to measure our financial performance and sustainability. This report describes the seven KPIs and then describes the Income, Expenditure and Balance Sheet data that the KPIs are drawn from. These KPIs were approved by Council in May 2019. The report concludes with an outlook for the future.
Key Financial Performance Indicators
Historic Cost Operating Surplus/Total Income
The Statement of Comprehensive Income (SOCI) shows a surplus before gains and losses of £1.1m (2021-22 £28.0m deficit).
This table shows a reconciliation between this figure and the HCOS.
| 2022-23 | 2021-22 | |
|---|---|---|
| Surplus / (Deficit) before gains and losses from SOCI | £1.1m | (£28.0m) |
| Capital grants | (£5.5m) | (£41.3m) |
| Adjustment for pension schemes | (£10.6m) | £72.5m |
| Valuation adjustment for depreciation | £21.2m | £16.8m |
| Valuation adjustment for derivatives | £0m | (£2.3m) |
| HCOS | £6.2m | £17.7m |
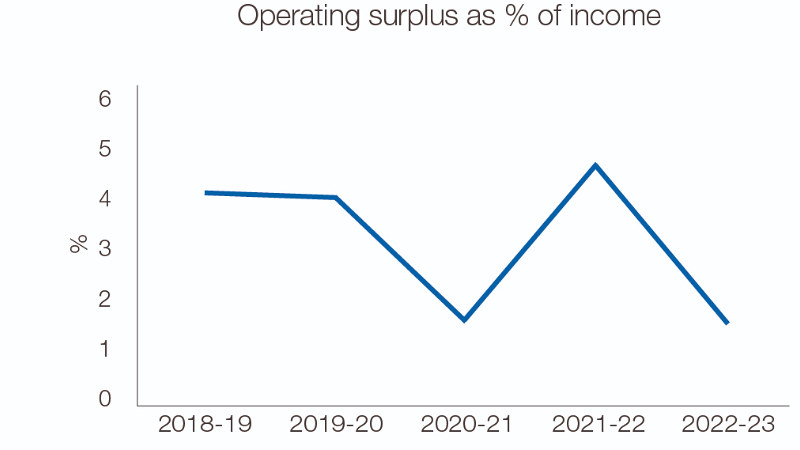
KPI - 1. HCOS/Total Income
Our HCOS surplus is disclosed in the table above as the best measure of our ability to generate cash and as such represents the level of surplus required to generate cash to fund our capital expenditure programme and meet loan payments.
For 2022-23 this was budgeted at a small deficit of £0.4m, effectively a breakeven position, but it improved as grant income was higher than budget and the actual result for the year is 1.7%, £6.2m.
A commentary on income and expenditure is included later in this review.
The HCOS takes the income and expenditure values recorded in the SOCI and adjusts them for valuation or material one-off items. These items are either infrequent e.g. capital grants or subject to market valuations e.g. pension valuations and so distort the underlying recurrent operating activity. Removing these items allows us to set and monitor a budget surplus at a consistent % of income. Including these items in the budgeted surplus would mean that as a % of income our target surplus could be materially different year on year and would make consistent reporting of the surplus challenging.
The rationale for these adjustments is described further.
| Area | Rationale |
|---|---|
| Capital Grants | Capital grants are dependent on capital spend which is recorded in the balance sheet. Including capital grants, which are now recognised only when the construction of the fixed assets has been completed, creates spikes in income and therefore surplus, this is evidenced by the recognition of the IAAPS grant of £38.9m in capital grants released in the previous year (2021-22) |
| Pension valuations | Both USS & LGPS are subject to periodic actuarial valuations and these valuations are heavily impacted by economic assumptions outside of the routine operational activity of management and therefore the valuation charges and credits are recognised after the HCOS. |
| Depreciation | Our buildings are subject to annual valuations and total depreciation is based on these “fair” values, which are impacted by market conditions and building cost inflation, outside the control of management. This adjustment reflects the valuation element of the total depreciation charge and is recognised after the HCOS. |
| Derivatives | We hold several derivatives instruments in place to protect against interest rate and exchange rate movements. These instruments are measured at market value, which is impacted by interest, inflation and exchange rates. As these may fluctuate significantly and are outside of routine operational management they are recognised after the HCOS. |
KPI - 2. Adjusted EBITDA
Adjusted EBITDA is widely used by the sector and provides a sector comparison of operating performance. This metric is earnings before interest, tax, depreciation, and amortisation, it is also adjusted to remove pension provision. EBITDA for 2022-23 is 12.3% of income (23.9% 2021-22). This is in line with previous years before 2021-22. The IAAPS capital grant increased income, on a one-off basis, in 2021-22.

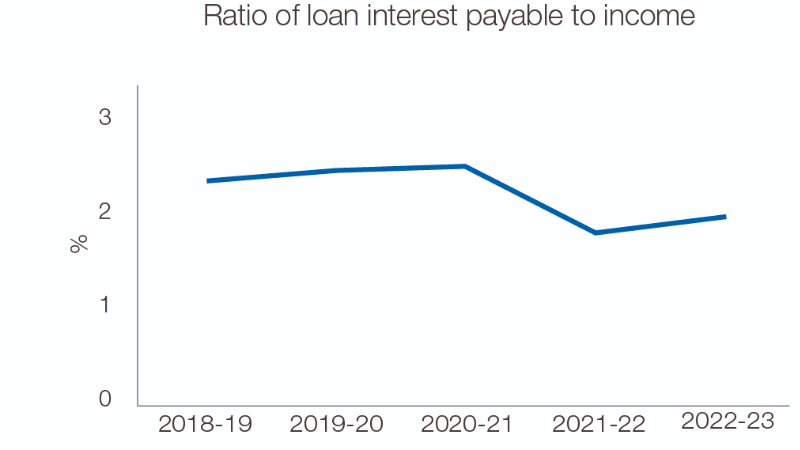
KPI - 3. Ratio of Interest Payable to Income
Interest payable to income is the metric used to show how much of our income is spent on paying the interest on our loans. Similar measures are used by some of our lenders to assess our financial performance. In 2022-23 our result was 2.0% (1.9% 2021-22). The majority of our borrowing is at fixed rates so our additional income created an improvement in cover.
KPI - 4. Net Debt to Net Assets – Gearing
Our gearing has fallen to 1.6% (6.4% 2021-22).
Net Debt to Net Assets is a measure to show the extent to which our assets are financed by debt. Whilst low compared to many sectors we have a high gross debt value relative to the HE sector. This reflects our financial strategy to borrow to fund investment whilst maintaining a high level of liquidity. Gearing is also a metric monitored by lenders and whilst the definition of debt varies our financial covenant gearing levels are well below the 50% threshold set by lenders.
In 2022-23 our Net Debt fell by £31.5m to £14.3m (2021-22 £45.8m).

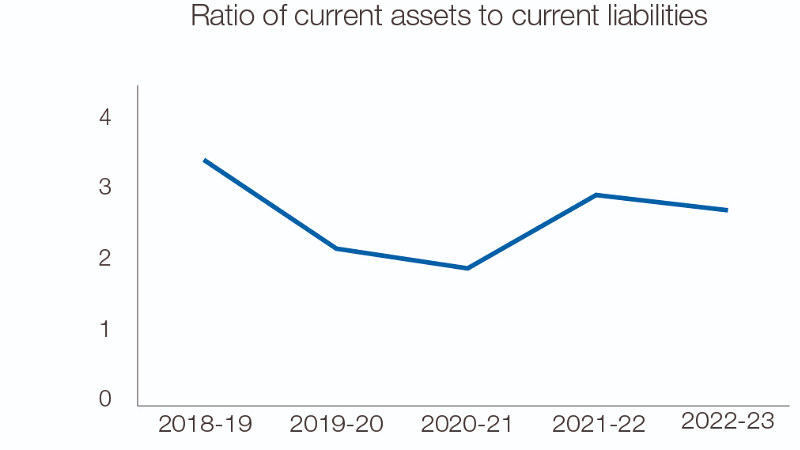
KPI - 5. Ratio of current assets to current liabilities
The ratio of current assets to current liabilities, known as the current ratio. This shows our ability to cover our current liabilities by current assets. Our financial strategy is to maintain high levels of liquidity, so the ratio is higher than many in the sector. There has been a small decrease in the ratio to 2.8:1 (2021-22 3.0:1). As we invest in refurbishing our estate we would expect this ratio as well as our Net Liquidity Days (KPI 7) to reduce.
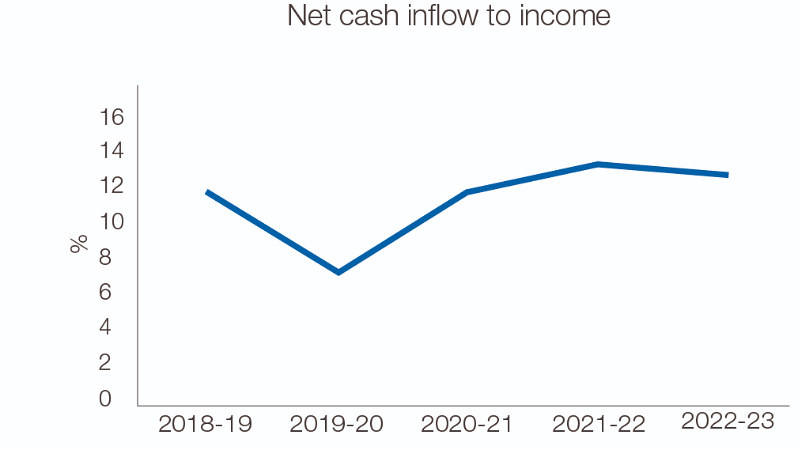
KPI 6. Net cash inflow from operating activities as % of income
This measure shows the cash flow from our ongoing regular activities as a proportion of total income. It does not include long-term capital expenditure or investment returns. It can be used to determine our ability to self-finance new investments or reduce debt. Operating cash inflow is £47.2m which represents 13.0% of income (£49.3m and 13.6% 2021-22).
KPI 7. Net Liquidity days
This metric indicates the number of days that we could operate without generating any cash inflows by showing the ratio of expenditure to income expressed in days. Our strategy is to retain high levels of liquidity and as a result our ratio is 248 days (2021-22 212 days). This includes the USS charge in expenditure.

Income
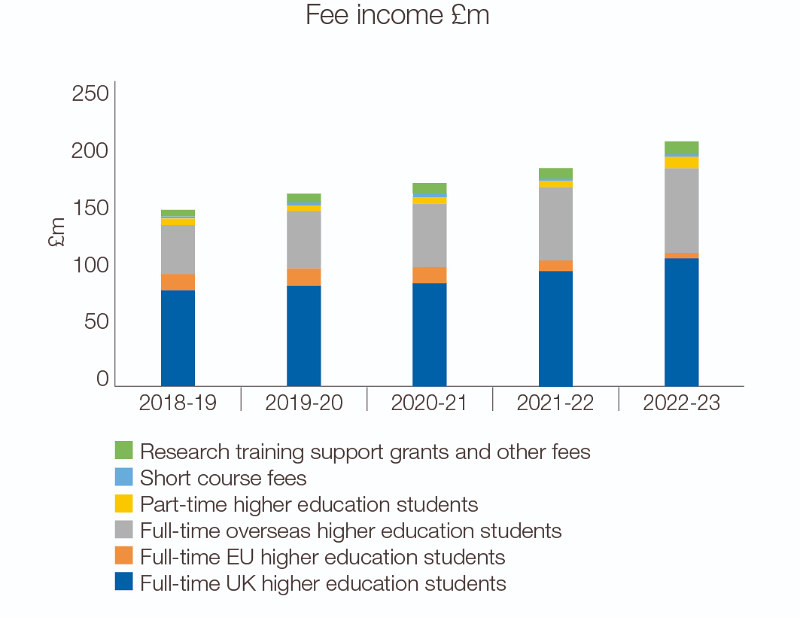
Total income increased marginally by £1.2m (0.3%) from £361.8m to £363m.
Tuition fee income increased by 9.1% to £205.9m. This was predominately due to an increase in full time home UK students (up £11.1m), and full time overseas students (up by £9m). Tuition fee income represents 56.7% of total income.
Total funding body grants decreased from £67.1m to £46.7m. The previous year included £29m received from UKRI for the IAAPS facility. In 2022-23 there was an increase in the UKRI recurrent grant of £5.2m.
Research grants were £45m (2021-22 £40.5m) an increase of 11.1% and reflects the growing portfolio of contracts we hold and the focus on research growth which is part of our strategy.
Other income at £58.4m has decreased by 1.2% (2021-22 £59.1m). There was an increase in income from residences and catering of £7.3m in 2022-23, which has been partially offset by the lack of capital grant income in 2022-23 (there was a £10m grant from WECA received in 2021-22 relating to the IAAPS facility).
Endowment and donation income for 2022-23 was £1.5m (2021-22 £2.3m).

Tuition Fee Income
Tuition Fee income increased by 9.1% to £205.9m (£188.8 m 2021-22).
Fees from full-time UK students rose by £11.1m and 11.6% respectively to £107.1m. With the undergraduate fee remaining at £9,250 this increase came from student number growth.
Fees from full-time overseas students (including EU students who now pay the overseas rate) rose by £5.3m to £76.8m. This source now represents 37.3% of all tuition fee income.
Fees from part-time students, short course and training student grants grew by £0.7m to £22.0m.
| Analysis of Fee-paying students as at 1st December | 2020-21 | 2021-22 |
|---|---|---|
| Full-time home fee status | ||
| Undergraduate | 12,021 | 12,450 |
| Postgraduate Taught | 712 | 510 |
| Postgraduate Research | 690 | 572 |
| Full-time Overseas fee status | ||
| Undergraduate | 1,681 | 1,907 |
| Postgraduate Taught | 1,146 | 1,153 |
| Postgraduate Research | 231 | 227 |
| Total | 16,481 | 16,819 |
This table summarises student numbers as at 1 December 2021 and 2022 respectively, this is the census date for HESA.
Expenditure
Expenditure reported in the SOCI decreased by £27.9m to £361.9m. This decrease includes a credit of £16.1m for the decrease in the USS pension provision.
Recurrent expenditure excluding this decrease is £378.0m, the equivalent values for 2021-22 is £322.7m which represents an increase of 17.1%. This reflects both increased activity from a prior year impacted by Covid-19, strategic investment and inflationary pressures.
Our staff costs at £192.2m have increased by £12.0m (6.7%) over 2022-23, whilst average FTE numbers increased by 138 (4.5%) to 3,221. Education and Research staff costs were £105.0m for 2022-23, 59.6% of total staff costs before pension adjustments.
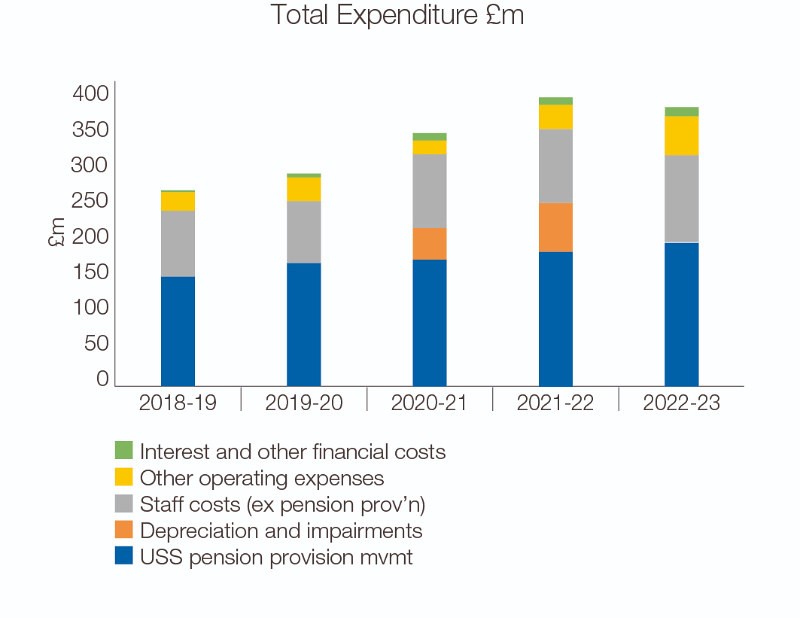
Our operating expenses at £126.7m have increased by 28.5% from £98.6m.
In the analysis of expenditure by activity (note 10), Academic Department expenditure increased by £17.8m to £139.4m and represents 36.9% of total expenditure before the decrease in the USS charge, an increase on previous years of 31.8%. When combined with Academic Services this rises to 47.2% of all expenditure before the USS decrease. Research grants, premises, residences, retail and catering, represent 8%, 14.6% and 12%, respectively, of all expenditure before the USS decrease.
Central Administration expenditure increased 14.6% from £20.5m to £23.5m.
Staff and student facilities expenditure increased by 10% to £18.8m. Residences, retail and catering operations expenditure increased by 21.2%, to £45.2m. There was a similar increase in income for this area of 20% (note 5).
Research expenditure increased by 11.8% to £30.4m reflecting the growth in income of 11.1% in the same period (note 4).
Depreciation and impairment increased by £11.5m, to £46.7m (an increase of 32.7%). Capital spend reduced during the previous two years of the pandemic, the rise in depreciation follows the higher levels of investment in buildings and equipment.
Other Comprehensive Income
The total comprehensive income in the year is £173.4m (2021-22 £125.9m).
This table summarises those entries reported after surplus for the year on the SOCI of £1.1m (2021-22 deficit £29.1m) and reason for the change from 2021-22.
| Item | Impact 2022-23 | Impact 2021-22 | Valuation impact |
|---|---|---|---|
| Actuarial gain in respect of pension schemes | £36.6m | £60.9m | 31 July 2023 liability discount rates used in establishing the valuation increased to 5.1% from 3.5% and this reduced the liabilities due from the LGPS. |
| Change in the fair value of tangible fixed assets | £135.7m | £92.5m | Building valuation is determined by either market value or replacement cost less an allowance for use, depreciation. Building costs increased by 13.0% in 2022-23 against 8.8% the previous year, which meant on a leasehold estate of £877.8m the net increase was £114.0m. |
| Change in the fair value of derivatives | £0m | £1.6m | Net gain of £1.5m on foreign exchange and interest rate swap derivatives used to manage loan interest rates and investments denominated in US Dollars. The interest rate swaps were exited in the previous year (2021-22). |
Balance Sheet
Fixed Assets
Our capital additions in 2022-23 were £25.5m (2021-22 £24.5m). The combination of this with depreciation and the revaluation gain reported in the table above saw fixed assets increase from £940.0m to £1,054.4m.
Current Assets
Current assets increased by £18.4m to £245.4m. Of this our investments increased by £23.9m to £209.6m, which is due to additional investments being made in the year.
Creditors, amounts falling in less than one year
These increased by £11.6m, to £87.4m, with an increase in trade payables of £7.2m and deferred income of £8m. Deferred income at 31 July 2023 of £50.6m is recognised as capital grant income, and relates to capital grants received where the performance criteria of the grants have not yet been met. Loan repayments due next year reduced to £2.1m from £5.0m at 31 July 2023.
Creditors, amounts falling due in more than one year
These reduced by £4.4m to £224.1m. Bank loan debt increased by £3.6m. The derivatives were disposed of in October 2022 at a settlement of £7.3m, and so only appear in the comparator figures.
Pension Provisions
Pension provisions have decreased by £47.5m to £102.4m. The USS is a multi-employer scheme with no basis to accurately identify our share of the assets and liabilities and therefore our deficit. We are required to estimate a provision for our obligation to make deficit recovery payments based on contributions approved at valuation. The opening balance of £108.5m is based on the March 2020 valuation. The 31 March 2023 valuation process is in progress and the USS is currently carrying out a technical consultation, which is expected to lead to a reduction in ongoing employer and member contributions going forward.
LGPS is also a multi-employer scheme in which liabilities and assets can be established for individual employers. We saw our pension deficit fall by £35m to £6.3m, this is mainly due to an actuarial gain of £36.6m. This reduction occurred as the discount rate used to price future liabilities increased to 5.1% from 3.5%. Contribution rates are determined by triennial valuations which uses a different set of assumptions. The scheme undertook its most recent valuation on 31 March 2022. Our cash contribution rate from April 2023 is 20.7% for future service, this has been 19.3% previously.
Going Concern
Council confirms that it has reasonable expectation that we have adequate resources to continue in operation for the foreseeable future. For this reason, it continues to adopt a going concern basis for preparing the Annual Accounts. In reaching this conclusion Council has reviewed the five year financial plan and our financial sustainability and is satisfied that the strategies, plans and policies in place will help ensure this financial sustainability is maintained. Council regularly reviews performance using the key performance indicators included in this review in areas that are relevant to financial sustainability. Council, through ARAC regularly reviews strategic and operational risks and any financial assessment of these as determined by management. Council, through Finance Committee, reviews the compliance with financial covenants in our loan documentation.
Financial Risk & Outlook
In financial terms we anticipated that 2022-23 would be a year of consolidation and our results show an increased income, together with significant cost pressures.
This is the first year of moving from our previously set surplus target of 3% of income, to break even. The results for the year have delivered a HCOS surplus of £6.2m with student recruitment similar to the previous year.
We recognise that the delivery of our strategy means that we will need to make increased revenue investment in the short term with the knowledge that the regulated home tuition fee level will remain at £9,250 until at least 2024-25. Council recognises that surpluses will have to flex as we deliver our strategy. In particular we anticipate a lower level of surplus in the next 2 years as we invest in growing our research activity, capital expenditure, and long-term maintenance. After this we expect to establish a new surplus target which will reflect the capital and revenue investment planned in our research, teaching, digital and carbon reduction plans. We continue to experience cost pressure in staff and operating expenses with higher inflation rates. The long-term effect of this is difficult to assess and this will have an impact on how the investment identified above is prioritised and approved. The surplus this year provides an improved financial position from which to fund these investments. These investments are discretionary and along with the discretionary elements of our operating budgets provide us with flexibility in the event of a downturn or sustained period of inflation. Whilst regulated fees are fixed in the medium-term, we either set the price, or prices are linked to costs, for around 70% of our income providing further scope to address cost inflation.
Equally we will start to see the financial benefits of our investments in the School of Management and IAAPS. These investments will help deliver our strategic objectives of increasing our income from non-regulated fees and growing our research income. The increase in research grants won in the year, together with the increase in QR funding following the last REF exercise, has led to the increase in research income for 2022-23.
In addition to the inflationary pressure that we have seen the impact on our costs we risk being affected by other sector-specific challenges including the maintenance of regulated tuition fees at their current levels and volatile pension costs, these are impacted by market conditions and initial results of the March 2022 LGPS valuation indicate an increase in employer contributions. Both USS and LGPS pension schemes have moved towards being fully funded. The recent technical consultation of USS may well lead to a reduction in both employer and member contributions going forward.
The maintenance and upgrading of our estate over the coming years has been identified and recognised in our spending plans, which will include an increasing focus on space utilisation and reflecting how buildings are now being used with hybrid working. We are very aware of the impact the built environment has on our carbon emissions and our ability to meet our net zero target by 2030. Achievement of our carbon targets will require changes to our buildings, our procurement, and our behaviours which our carbon action framework team are developing.
Martin Williams
Director of Finance