Our year was one of consolidation and looking forward following recent years which were dominated by COVID-19. Financial plans for the year reflected greater financial certainty and the return to more operational normality following the pandemic, this was best illustrated by a strong recruitment round in summer 2021. Our income from teaching, research and accommodation grew as these activities returned to pre COVID-19 levels. Income from hospitality also grew but has yet to reach pre COVID-19 levels as work and study patterns have changed and conference activity has yet to return to previous levels. Cash flow from operating activities increased on the previous year to £49.3m (2020-21 £35.2m) along with our internal measure of operating surplus, Historical Cost Operating Surplus, HCOS, at £17.7m (2020-21 £1.1m). This improvement came in part from increased income but more from lower expenditure with expenditure being deferred rather than saved as COVID-19 delayed maintenance and other projects.
Our priorities remain to provide a high-quality educational experience, excellent research and to support the health and wellbeing of all members of our community.
As inflation increased in the later part of the financial year, we started to see the impact of this on our expenditure plans and we expect this to continue, equally we like many other employers have faced recruitment and retention challenges in several areas, which itself meant not all pay budgets were spent in the year.
We have continued to retain significant cash and investment balances in preparation for supporting future investments to support our Strategy. Operating cash inflows were £49.3m (2020-21 £35.2m), we spent £27.6m (2020-21 £48.1m) on capital investments as work was completed on our two substantial capital projects, a new building for our School of Management and our facility for the Institute of Advanced Automotive Propulsion Systems (IAAPS), both were handed over to us towards the end of the year. Additionally grant income of £38.9m has been recognised now the IAAPS facility is operational.
The result of these cash flows reduced our Net Debt by £16.8m to £45.8m, our cash and investment balances leave considerable scope for investment to support our new strategy. In August 2022 we committed to a debt refinancing exercise which resulted in us repaying our European Investment Bank (EIB) loan and 3 derivative instruments for a total of £55.6m and drawing down a £50.0m private place borrowing due for repayment in 2072, the new borrowings are at a lower all-in cost than the EIB loan.
Our financial strategy is based on generating enough operating cashflow to fund the investment in people and infrastructure that our strategy describes. Council and the Executive monitors our internal measure of surplus, HCOS. This provides a more meaningful measure of our operating performance and excludes the material valuation adjustments which are shown on the Statement of Comprehensive Income (SOCI). Further explanation and a detailed reconciliation of the deficit shown in the SOCI to HCOS is included.
HCOS is one of seven Key Performance Indicators that we use to measure our financial performance and sustainability. This report describes the seven KPIs and then describes the Income, Expenditure and Balance Sheet data that the KPIs are drawn from. These KPIs were approved by Council in May 2019. The report concludes with an outlook for the future.
Key Performance Indicators
Historic Cost Operating Surplus
The Statement of Comprehensive Income (SOCI) shows a deficit before gains and losses of £28.0m (2020-21 £32.0m deficit).
The table shows a reconciliation between this figure and the HCOS.
| 2021-22 | 2020-21 | |
|---|---|---|
| (Deficit) before gains and losses from SOCI | (£28.0m) | (£32.0m) |
| Capital Grants | (£41.3m) | (£4.2m) |
| Adjustment for pension schemes | £72.5m | £3.8m |
| Impairment of land and buildings | £0m | £21.5m |
| Valuation adjustment for depreciation | £16.8m | £13.4m |
| Valuation adjustment for derivatives | (£2.3m) | (£1.4m) |
| HCOS | £17.7m | £1.1m |
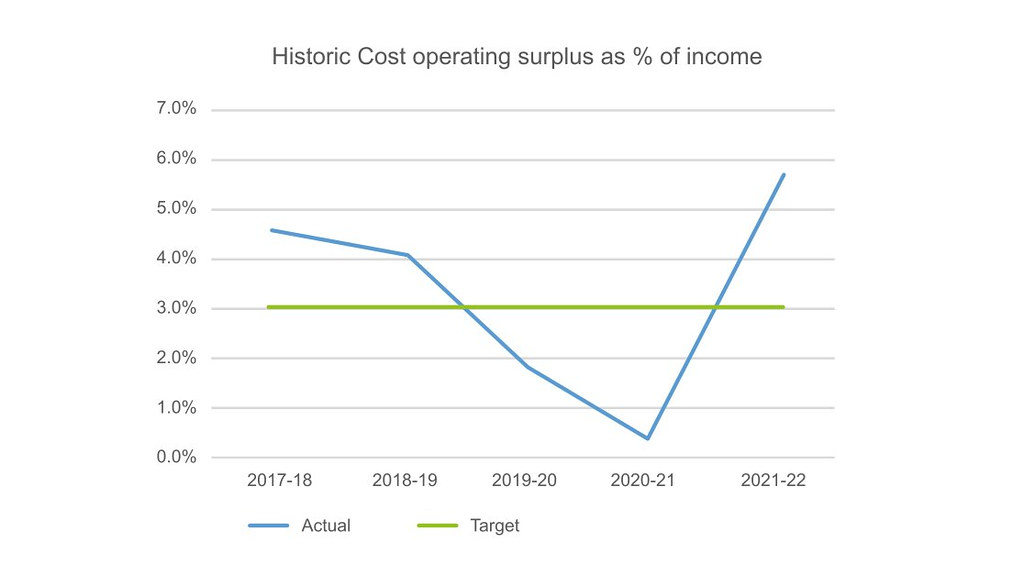
The HCOS takes the income and expenditure values recorded in the SOCI and adjusts them for valuation or material one-off items. These items are either infrequent e.g. capital grants or subject to market valuations e.g. pension valuations and so distort the underlying recurrent operating activity. Removing these items allows us to set and monitor a budget surplus at a consistent % of income, historically this has been 3%. Including these items in the budgeted surplus would mean that as a % of income our target surplus could be materially different year on year and would make consistent reporting of the surplus challenging.
| Area | Rationale |
|---|---|
| Capital Grants | Capital grants are dependent on capital spend which is recorded in the balance sheet. Including capital grants, which are now recognised only when the construction of the fixed assets has been completed, creates spikes in income and therefore surplus, this is evidenced by the recognition of the IAAPS grant of £38.9m in capital grants released in the year. |
| Pension valuations | Both USS & LGPS are subject to periodic actuarial valuations and these valuations are heavily impacted by economic assumptions outside of the routine operational activity of management and therefore the valuation charges and credits are recognised after the HCOS. |
| Depreciation | Our buildings are subject to annual valuations and total depreciation is based on these “fair” values, this is impacted by market conditions and building cost inflation, outside the control of management. This adjustment reflects the valuation element of the total depreciation charge and is recognised after the HCOS. |
| Derivatives | We hold several derivatives instruments in place to protect against interest rate and exchange movements. These instruments are measured at market value and this is impacted by interest, inflation, and exchange rates and as these may fluctuate significantly and are outside of routine operational management they are recognised after the HCOS. |
The following financial KPIs are those monitored by management and the further commentary represents a summary of our results and comparison with previous years.
KPI 1. HCOS/Total Income
Our HCOS surplus is disclosed in the table as the best measure of our ability to generate cash and as such represents the level of surplus required to generate cash to fund our capital expenditure programme and meet loan payments.
For 2021-22 this was budgeted at 0.7%, effectively a breakeven position, but it improved as expenditure was lower with the actual result 5.6%, £17.7m.
A commentary on income and expenditure is included later in this review.
KPI 2. Adjusted EBITDA
Adjusted EBITDA is widely used by the sector. This metric is earnings before interest, tax, depreciation, and amortisation, it is also adjusted to remove pension provision. We have this to provide a sector comparison of operating performance. EBITDA is reported at 23.9% of income (11.2% 2020-21). The improvement is a result of the higher HCOS achieved and depreciation returning to a normal level following the IAAPS impairment in 2020-21 of £21.5m.

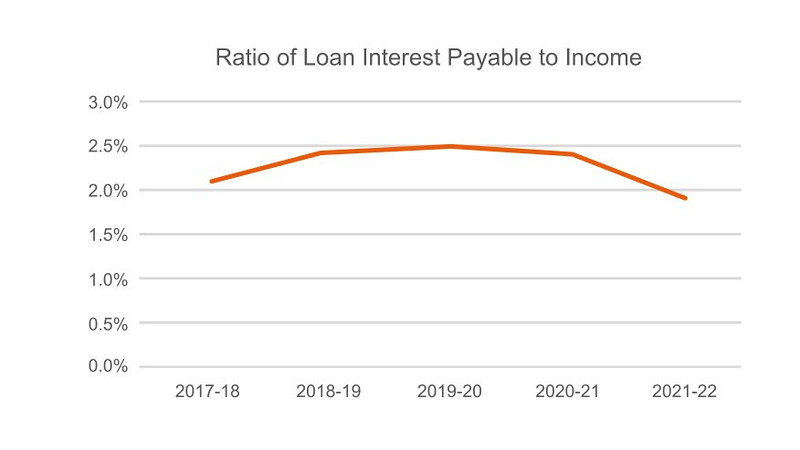
KPI 3. Ratio of Interest Payable to Income
Interest payable to income is the metric used to show how much of our income is spent on paying the interest on our loans. Similar measures are used by some of our lenders to assess our financial performance. In 2021-22 our result was 1.9% (2.3% 2020-21). The majority of our borrowing is at fixed rates so our additional income created an improvement in cover.
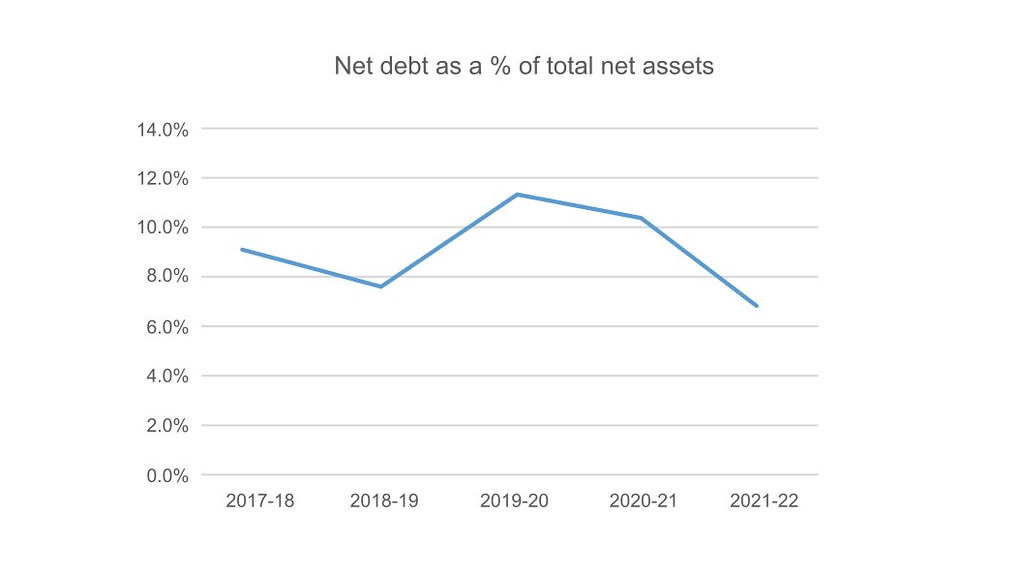
KPI 4. Net Debt to Net Assets – Gearing
Our gearing has fallen to 7.1% (10.8% 2020-21).
Net Debt to Net Assets is a measure to show the extent to which our assets are financed by debt. Whilst low compared to many sectors we have a high gross debt value relative to the HE sector. This reflects our financial strategy to borrow to fund investment whilst maintaining a high level of liquidity. Gearing is also a metric monitored by lenders and whilst the definition of debt varies our financial covenant gearing levels are well below the 50% threshold set by lenders.
In 2021-22 our Net Debt fell by £16.8m to £45.8m (2020-21 £62.6m).
KPI 5. Ratio of current assets to current liabilities
The ratio of current assets to current liabilities, known as the current ratio. This shows our ability to cover our current liabilities by current assets. Our financial strategy is to maintain high levels of liquidity so the ratio is higher than many in the sector. The increase in the ratio to 3.1:1 (2020-21 1.9:1) is due to the reduction in current liabilities as the IAAPS capital grant has now been recognised as income.

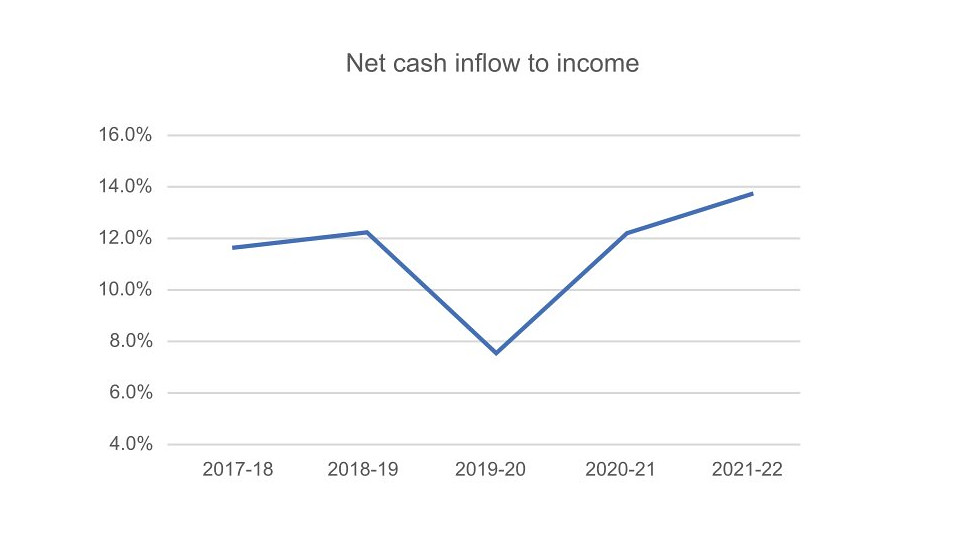
KPI 6. Net cash inflow from operating activities as % of income
This measure shows the cash flow from our ongoing regular activities as a proportion of total income. It does not include long-term capital expenditure or investment returns. It can be used to determine our ability to self-finance new investments or reduce debt. Operating cash inflow is £49.3m which represents 13.6% of income (£35.2m and 12.2% 2020-21).
KPI 7. Net Liquidity days
This metric indicates the number of days that we could operate without generating any cash inflows by showing the ratio of expenditure to income expressed in days. Our strategy is to retain high levels of liquidity and as a result our ratio is 212 days (2020-21 253 days). The reduction is caused by the inclusion of the USS charge in expenditure, without this the metric would be 258 days.

Income
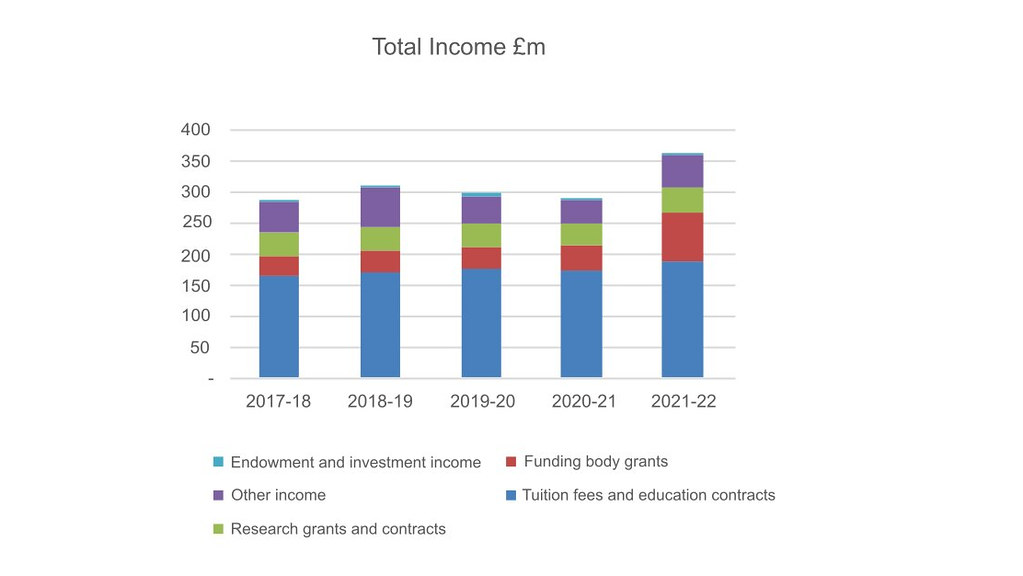
Total income increased by 24.9% from £289.5m to £361.8m, this includes the recognition of capital grants for the construction of the IAAPS facility of £38.9m.
Tuition fee income increased by 8.8% to £188.8m reflecting the additional students now registered following static income during the COVID-19 pandemic. Tuition fee income represents 52% of total income.
Total Funding body grants increased from £39.3m to £67.1m as it includes £28.9m received from UK Research and Innovation (UKRI) for the IAAPS facility. Increases also came through for Innovation Centre for Applied Sustainable Technologies (i-Cast), Higher Education Innovation Funding (HEIF) grants.
Research grants were £40.5m (2020-21 £37.2m) an increase of 8.9% and reflects the growing portfolio of contracts we hold and greater activity following the interruption created by the COVID-19 pandemic and the focus on research growth which is part of our strategy.
Other income at £63.1m has increased by 70% (2020-21 £37.1m). This increase includes capital grant income from West of England Combined Authority (WECA) for IAAPS along with significant increase in accommodation income over the previous year. Hospitality and Sports income have also increased but are yet to reach pre-pandemic levels as campus footfall remains below pre-pandemic levels. Endowment and donation income at £2.3m is consistent over both years.
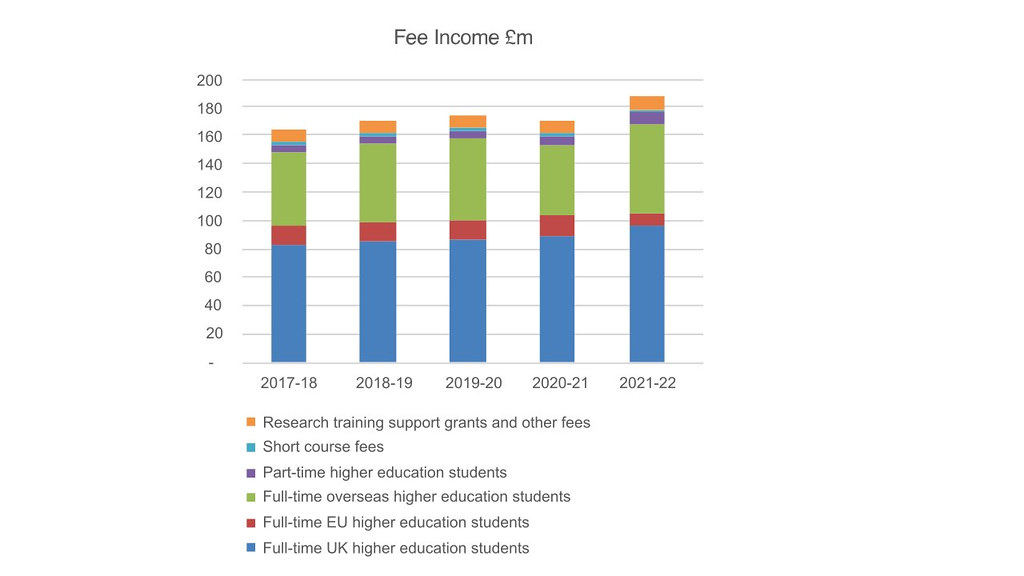
Tuition Fee Income
Tuition Fee income increased by 8.8% to £188.8m (£173.6m 2020-2021).
Fees from full time UK students rose by £6.7m (7.5%) to £96.0m with the undergraduate fee remaining at £9,250 this increase came from student number growth.
Fees from full time overseas students now includes European students paying the overseas fee rates and total fee income increased by 7.5m (11.7%) to £71.5m. This includes cohorts of students paying home level fees as they registered pre-Brexit. This source now represents 37.9% of all tuition fee income. Full time EU fees fell from £13.8m to £8.3m reflecting the transition of new students to overseas fees.
Fees from part-time students, short course and training student grants grew by £1.0m to £21.3m.
Analysis of Fee-paying students as at 1st December
| 2020-21 | 2021-22 | |
|---|---|---|
| Full time Home fee status | ||
| Undergraduate | 11,888 | 12,021 |
| Postgraduate Taught | 804 | 712 |
| Postgraduate Research | 723 | 690 |
| Full time Overseas fee status | ||
| Undergraduate | 1,674 | 1,681 |
| Postgraduate Taught | 780 | 1,146 |
| Postgraduate Research | 245 | 231 |
| TOTAL | 16,114 | 16,481 |
The table summarises student numbers at 1 December 2020 and 2021 respectively, this is the census date for the Higher Education Statistics Agency (HESA).
Expenditure
Expenditure reported in the SOCI increased by £68.3m to £389.8m, this increase includes a charge of £67.1m for the increase in the USS pension provision following the implementation of the March 2020 valuation.
Recurrent expenditure excluding this charge is £322.7m, the equivalent value for 2020-21 is £303.5m which represents an increase of 6.3%. This reflects both increasing activity and strategic investment, along with some inflationary pressures that started to impact spending in certain areas.
Our staff costs at £180.2m have increased by £5.8m (3.3%) over 2020-21, whilst average FTE numbers fell by 89 (2.8%) to 3,803 the impact of pay awards, including a one-off University cost of living support and employer costs, notably National Insurance and pension contributions increased the total cost of staff by more than the FTE increase. Education and Research staff costs were £94.6m, 54.3% of total staff costs before pension adjustments. We continue to experience challenges in recruiting staff across all our activities and this resulted in an underspend against budget which contributed to the improved HCOS.
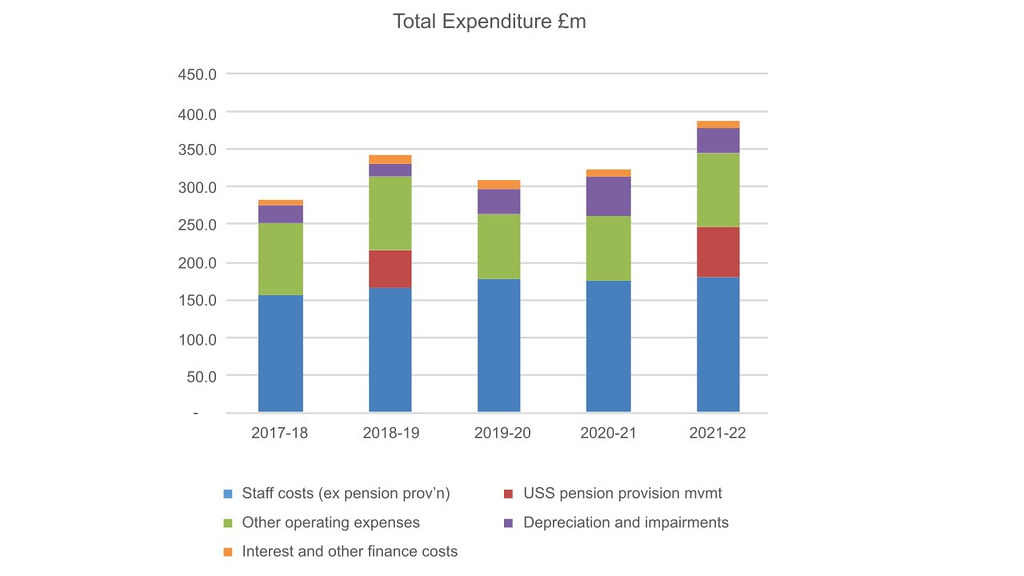
Our operating expenses at £98.6m have increased by 11.9% from £88.1m, much of the expenditure increase is driven by the growth in commercial activities, such as accommodation and retail which continue to find generating operating surpluses challenging. In other central areas of operating expenditure notable underspends were reported within digital expenditure and estate long-term maintenance expenditure and these contributed to the improved HCOS.
In the analysis of expenditure by activity (note 9), Academic Department expenditure increased by £7.6m to £121.6m and represents 37.8% of total expenditure before the USS charge, a slight decrease on previous years of 35.5%. When combined with Academic Services this rises to 47.1% of all expenditure before the USS charge.
Central Administration expenditure increased 14.5% from £17.9m to £20.5m and reflects an increase in activity from the reduced levels of expenditure experienced during the pandemic where only essential expenditure was incurred.
Staff and student facilities increased by 11% to £17.1m as more student focused activity returned to the campus, this is mirrored by expenditure supporting our residences, retail and catering operations which increased by £4.3m, 13%, to £37.3m. Research expenditure increased by 8.8% to £27.2m reflecting the growth in income of 8.7% in the same period.
Depreciation increased by £3.1m, 9.3% reflecting the increase in building valuations reported at 31 July 2021. 2020-21 charge of £53.7m included an impairment of £21.5m for the IAAPS facility.
Other Comprehensive Income
The total comprehensive income in the year is £125.9m (2020-21 £23.5m).
The table summarises those entries reported after deficit for the year on the SOCI of £29.1m (2020-21 deficit £21.9m) and reason for the change from 2020-21.
| Item | Impact 2021-22 | Impact 2020-21 | Valuation impact |
|---|---|---|---|
| Actuarial gain in respect of pension schemes | £60.9m | £9.5m | 31 July 2022 liability discount rates used in establishing the valuation increased to 3.31% from 0.89% and this reduced the liabilities due from the LGPS. |
| Change in the fair value of tangible fixed assets | £92.5m | £32.3m | Building valuation is determined by either market value or replacement cost less an allowance for use, depreciation. Building costs increased by 8.8% in 2021-2022 against 3.5% the previous year, on a leasehold estate of £758.0m the net increase was £58.0m, market value increases were £34.5m |
| Change in the fair value of derivatives | £1.6m | £3.5m | Net gain of £1.6m on foreign exchange and interest rate swap derivatives used to manage loan interest rates and investments denominated in US Dollars. |
Balance Sheet
Fixed Assets
Our capital additions in 2021-22 were £24.5m (2020-21 £39.5m). The combination of this with depreciation and the revaluation gain reported in the table saw fixed assets increase from £858.1m to £940.0m. Both the IAAPS facility and the new building for the School of Management were completed in the year and are now classified as Freehold and Leasehold assets respectively. Both the IAAPS facility and the new building for the School of Management were completed in the year and are now classified as Freehold and Leasehold assets respectively.
Current Assets
Current assets increased by £4m to £227.0m. Of this our investments increased by £3.6m to £185.7m and this reflects the additional cash generated through our operations that we have retained as underlying investments fell in the year with short-term cash holdings increasing as volatility in market returns existed throughout the year and some investment disposals were retained as cash.
Creditors, amounts falling in less than one year
These reduced by £40.4m, to £75.8m, deferred income at 31 July 2021 of £38.9m is now recognised as capital grant income. Operating creditors increased by £6.2m and this included payroll costs for additional cost of living awards made by us to support our staff and were paid in the new year. Loan repayments due next year reduced to £5.0m from £10.0m at 31 July 2021.
Creditors, amounts falling due in more than one year
These reduced by £11.5m to £228.5m. Bank loan debt reduced by £5.0m and derivatives fell in value by £6.2m to £7.7m as the outlook is for interest rates to rise and therefore the market value of the derivative will fall. These derivatives were disposed of in October 2022 at a settlement of £7.3m.
Pension Provisions
Pension provisions have increased by £11.8m to £149.9m.
The USS is a multi-employer scheme with no basis to accurately identify our share of the assets and liabilities and therefore our deficit. We are required to estimate a provision for our obligation to make deficit recovery payments based on contributions approved at valuation. The opening balance of £41.1m is based on the March 2018 valuation, in November 2021 the March 2020 valuation was approved by the USS Trustee. This valuation requires larger employer contributions over a longer period than the 2018 valuation and as a result our estimate of future obligations increased by £67.5m to £108.5m.
LGPS is also a multi-employer scheme in which liabilities and assets can be established for individual employers. We saw our pension deficit fall by £55.7m to £41.4m as asset values increased by £4.6m, and liabilities reduced by £51.1m, this reduction occurred as the discount rate used to price future liabilities increased to 3.5% from 1.6%. Contribution rates are determined by triennial valuations which uses a different set of assumptions. The scheme undertook its most recent valuation on 31 March 2019, our current cash contribution rate is 19.3% for future service, against a scheme estimate of 25.9%. Details of contribution rates due following the 31 March 2022 valuation will be published in November 2022 and become effective on 1 April 2023.
Going Concern
Council confirms that it has reasonable expectation that we have adequate resources to continue in operation for the foreseeable future. For this reason, it continues to adopt a going concern basis for preparing the Annual Accounts. In reaching this conclusion it has reviewed our sustainability and is satisfied that the strategies, plans and policies in place will help ensure this financial sustainability is maintained. Council regularly reviews performance using the key performance indicators included in this review in areas that are relevant to financial sustainability. Council, through Audit and Risk Assurance Committee (ARAC) regularly reviews strategic and operational risks and any financial assessment of these as determined by management. Council, through Finance Committee, reviews the compliance with financial covenants in our loan documentation.
Financial Risk & Outlook
In financial terms we anticipated that 2021-22 would be a year of recovery and consolidation and our results show a much improved financial position during the year as we returned to more normal levels of activity. This follows the disruption caused by the COVID-19 pandemic which presented an extraordinary series of challenges over the last eighteen months for students and staff alike.
Student recruitment has recovered strongly in particular from those travelling from overseas and as a result accommodation occupancy rates have returned to those levels experienced before the pandemic. Equally as campus footfall has increased other income generating operations have seen income grow, although not to the levels experienced prior to the pandemic. This contributed to our improved surplus for the year.
We had previously set our surplus targets at 3% of income as at this level we will generate the operating cashflow needed to invest in our strategy and to meet our loan repayments. We recognise however that the delivery of our strategy means that we will need to make increased revenue investment in the short term with the knowledge that the regulated home tuition fee level will remain at £9,250 until at least 2024/25. Council recognises that surpluses will have to flex as we deliver our strategy. In particular we anticipate a lower level of surplus in the next 2 years as we invest in growing our research activity. After this we expect to establish a new surplus target which will reflect the capital and revenue investment planned in our research, teaching, digital and carbon reduction plans. More recently we have experienced cost pressure in staff and operating expenses as inflation starts to rise. The long-term effect of this is difficult to assess and this will have an impact on how the investment identified is prioritised and approved. The improved HCOS this year provides an improved financial position from which to fund these investments. These investments are discretionary and along with the discretionary elements of our operating budgets provide us with flexibility in the event of a downturn or sustained period of inflation. Whilst regulated fees are fixed in the medium-term, we either set the price, or prices are linked to costs, for around 70% of our income providing further scope to address cost inflation.
Equally we will start to see the financial benefits of our most recent investments in the School of Management and IAAPS. These investments will help deliver our strategic objectives of increasing our income from non-regulated fees and growing our research income. Our impressive REF outcome also means we will be receiving more income to support to Research activity.
In addition to the inflationary pressure that we have recently seen start to impact on our costs we risk being affected by other sector specific challenges including the maintenance of regulated tuition fees at their current levels and volatile pension costs, these are impacted by market conditions and initial results of the March 2022 LGPS valuation indicate an increase in employer contributions. USS contributions are fixed based on the March 2020 valuation, future valuations will directly impact employer contributions.
COVID-19 will have some lasting effects on how we work and study. We have established a successful blended learning experience and in the coming months we will learn of the benefits offered through the adoption of hybrid working by staff, this will present opportunities to change the way we use our space. In parallel with this significant investment in the maintenance and upgrading of our estate over the coming years has been identified and recognised in our spending plans. We are very aware of the impact the built environment has on our carbon emissions and our ability to meet our net zero target by 2030. Achievement of our carbon targets will require changes to our buildings, our procurement, and our behaviours which our carbon action framework team are developing.
Martin Williams,
Director of Finance