When to use the Infographic component
Use the Infographic component to add charts to your page so you can display data clearly and accessibly for users.
You can use the Infographic component on a:
- Campaign
- Project
When to use each type of chart
Choose the most appropriate chart for your data.
Bar chart
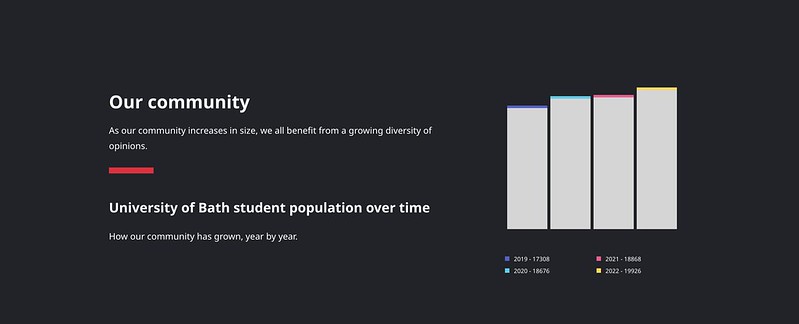 An example of the Bar chart infographic. We've changed the data for illustrative purposes.
A Bar chart uses up to ten data points. The data is presented in bars which are measured against an axis. The larger the number or percentage, the taller the bar.
As an example, you could use a Bar chart to show how the student population has changed over the last four years, using one bar per year.
Fraction
 An example of the Fraction chart infographic. We've made up the data for illustrative purposes.
A Fraction chart uses two data points. The data is presented as one number over another in a fraction.
As an example, you could use a Fraction chart to show how many students, out of those surveyed, shop at Fresh each week.
Pie chart
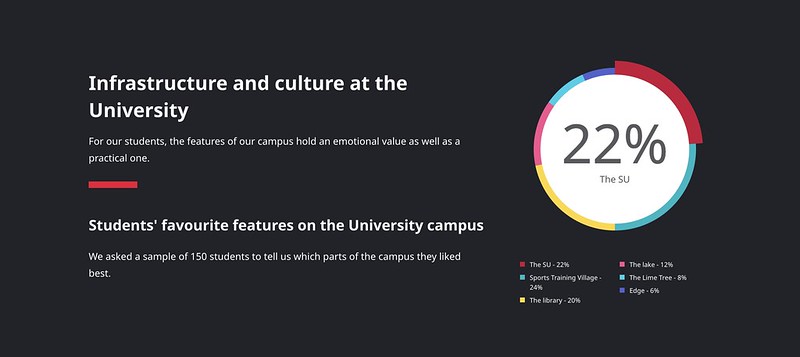 An example of the Pie chart infographic. We've made up the data for illustrative purposes.
A Pie chart uses up to ten data points. It presents the data in a circle with a segment for each data point. The larger the number or percentage, the larger the segment.
As an example, you could use a Pie chart to show which campus features students like most, with a segment for each feature.
Value
 An example of the Value chart infographic using data from September 2022.
A Value chart shows one data point. This is useful for drawing attention to a particular figure or percentage.
As an example, you could use a Value chart to display the percentage of our UK graduates who are in high-skilled employment 15 months after leaving Bath.
Versus chart
 An example of the Versus chart infographic using data from September 2022.
A Versus chart compares two data points. It presents the data on a circle, split into two segments, with the larger segment representing the larger number or percentage.
As an example, you could use a Versus chart to compare the percentages of undergraduate and postgraduate students at Bath.
Things to avoid
Don't use an Infographic component for data that's not related to the content on your page. The charts should provide additional information to support your Campaign or Project.
Creating accessible content
You must make sure your content is accessible.
As a public sector body, we're legally required to make the content on our website as accessible as possible. The government checks our content to make sure it complies with the internationally recognised guidelines from the World Wide Web Consortium (W3C).
Find out more about accessibility or contact beta-content@bath.ac.uk if you have any questions.
Finding the Infographic component
You can add:
- one infographic to a Project page
- up to two infographics to a Campaign page
To find the component in the Campaign and Project templates:
- Open the drop-down menu under 'Drag and drop components'.
- Select 'Infographic'.
- Click 'Add component'.
The Infographic component will appear beneath 'Component(s) currently in use'.
Adding content to the Infographic component

You can add up to three charts to each Infographic section.
Title and summary
Add a heading to the Title field to describe the charts in your Infographic section.
You can also add a summary to explain the charts and the information they provide.
Section appearance
Select one of the radio buttons next to:
- dark text on a light background
- light text on a dark background
Look at the preview page to help you decide which appearance looks best with the rest of the content.
Adding a chart
- Click the 'Add a chart' button.
- Add a title and description for the chart to explain to users what the data means and where it comes from.
- Use the radio buttons to select your chart type - the microcopy explains how many data points you can use in each chart.
- Use the 'Value type' radio buttons to select either numbers or percentages.
To add data points:
- Click the 'Add a data point' button.
- Add your first piece of data and its label into the fields - if your data needs a unit of measurement, add it to the Data point label field.
- Repeat the process for each of your data points.
For example:
- Data point label - 'Percentage of students under age 25'
- Data point value - '85'
Moving your content around the page
You can drag and drop each:
- Data point to change the order they appear in the Chart
- Chart to change the order they appear in the Infographic section
- Infographic component to reorder the sections on a page
Click 'Collapse this section' to hide an Infographic component or each of its Charts while you work on other areas of the page. The content will still appear on the preview and published pages if you collapse part of the template.